Tennessee Occupational Employment and Wages – May 2017
Tennesseans took home a little more money in their paycheck last year according to the latest data released by the Tennessee Department of Labor and Workforce Development (TDLWD).
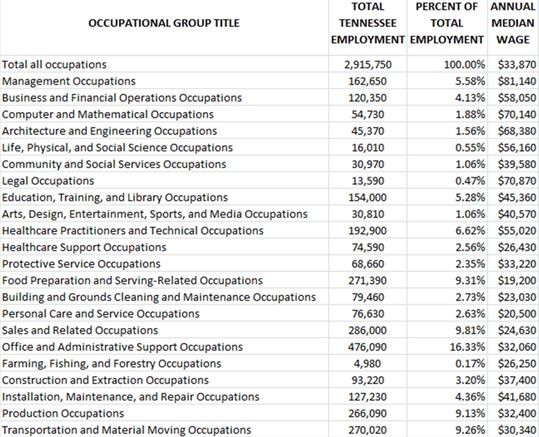
The median wage earned for all Tennessee occupations increased by 3.16 percent between May 2016 and May 2017 to $33,870.
“It’s always a positive to see wages increase, by amount,” said TDLWD Commissioner Burns Phillips. “The state’s economy is thriving and more money is a person’s paycheck is going to help that continue.”
The largest occupational groups in the state were office and administrative, sales and related, food preparation and serving, transportation and material moving, healthcare practitioners and healthcare support, and production occupations.
Healthcare practitioners and technical occupations employed 193,000 workers, while healthcare support occupations had employment of 75,000 workers. Both groups combined made up nearly 9.2 percent of Tennessee’s jobs, which is greater than the national average of 9.0 percent. Annual median wages for healthcare practitioners and technical occupations, the largest of the two healthcare occupations groups, varied within the state from $60,200 in Memphis to $46,360 in Morristown.

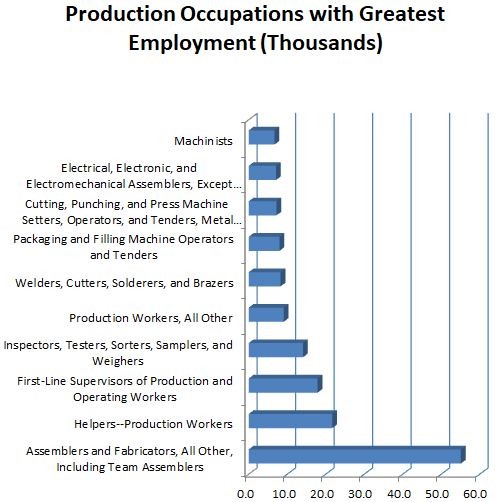
Assemblers and fabricators led the production occupations group in Tennessee. The Cleveland area had the highest proportion of production workers to total employment at 20.88 percent.

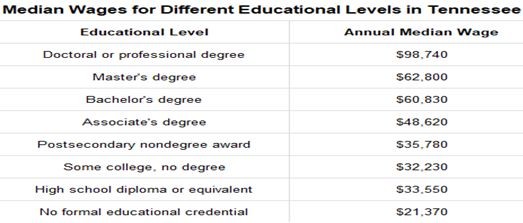
The latest statistics show the value of having educational or postsecondary training. The median annual wage for someone with a bachelor’s degree was $60,830, almost twice the average salary of $33,550 for a person with only a high school diploma or equivalent. The difference in annual wages for someone with some college, verses no formal education, was on average is $11,000 a year.


