Area prices rose 0.1 percent in September; up 2.1 percent over the past year
Consumer Price Index, South Region September 2024
The Consumer Price Index for All Urban Consumers (CPI-U) for the South rose 0.1 percent in September, the U.S. Bureau of Labor Statistics reported today. A notable decline in the gasoline index was more than offset by increases in the shelter, medical care services, and apparel indexes. (Data in this report are not seasonally adjusted. Accordingly, month-to-month changes may reflect the impact of seasonal influences.)
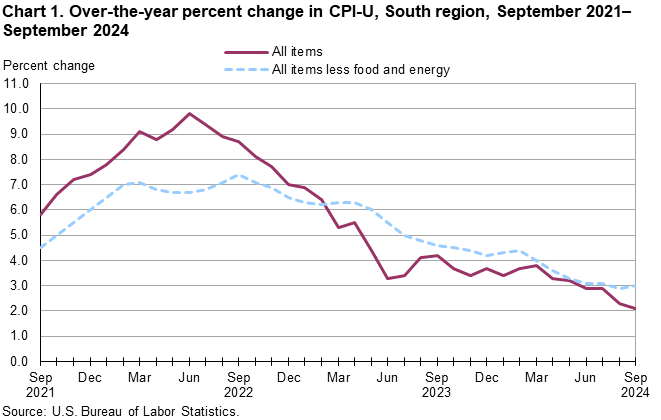
The all items CPI-U for the South increased 2.1 percent for the 12 months ending in September, after increasing 2.3 percent for the 12-month period ending in August. (See chart 1 and table A.) The index for all items less food and energy advanced 3.0 percent over the past 12 months. The food index continued to increase, up 2.2 percent over the past year. In contrast, the energy index fell 6.9 percent over the same period. (See table 1.)
Food
The food index rose 0.4 percent in September, reflecting increases for the food at home (+0.4 percent) and food away from home (+0.3 percent) indexes. Four of the six major grocery store food group indexes increased over the month. The index for meats, poultry, fish, and eggs rose 1.1 percent in September, as did the index for fruits and vegetables. The index for cereals and bakery products rose 1.0 over the month, while the index for dairy and related products increased 0.6 percent over the same period. In comparison, the index for nonalcoholic beverages and beverage materials declined in September, as did the index for other food at home.
The food index rose 2.2 percent for the 12 months ending in September. The index for food away from home increased 3.5 percent over the past year, while the index for food at home rose 1.4 percent over the same period. Five of the six major grocery store food group indexes increased over the past year, led by a 4.3-percent increase in the index for meats, poultry, fish, and eggs.
Energy
The energy index declined 3.0 percent in September, largely attributed to a 6.6-percent fall in the gasoline index. The natural gas index declined 0.8 percent over the month, while the electricity index rose 1.2 percent over the same period.
The energy index decreased 6.9 percent for the 12 months ending in September, reflecting a 15.0-percent fall in the gasoline index. In contrast, the indexes for electricity (+2.1 percent) and natural gas (+1.4 percent) increased over the past year.
All items less food and energy
The index for all items less food and energy rose 0.4 percent in September. The shelter index rose 0.5 percent over the month, reflecting increases in the indexes for owners’ equivalent rent (+0.5 percent) and rent of primary residence (+0.3 percent). Other indexes with notable increases in September include medical care services (+1.2 percent) and apparel (+2.2 percent). In comparison, the education and communication index declined 0.9 percent in September.
The index for all items less food and energy advanced 3.0 percent for the 12 months ending in September, after increasing 2.9 percent for the 12-month period ending in August. The index for shelter (+4.7 percent) was the largest contributor to the total 12-month increase in the all items less food and energy index. The indexes for owners’ equivalent rent (+5.1 percent) and rent of primary residence (+4.8 percent) also increased over the past year.
Geographic divisions
Additional price indexes are now available for the three divisions of the South. In September, the all items index increased 0.4 percent in the East South Central division and 0.1 percent in the West South Central division. The all items index for the South Atlantic division was unchanged in September.
Over the year, the all items index increased 3.2 percent in the East South Central division, 2.1 percent in the South Atlantic division, and 1.7 percent in the West South Central division.


